Categories
Create Advanced Excel Dashboards with Formulas, VLOOKUP & Interactive Charts
0.0
(0 Reviews)
7 Views
Service Description
1️⃣ SEO-Optimized Gig Title Variations
Create Advanced Excel Dashboards with Formulas, VLOOKUP & Interactive Charts
2️⃣ Short Gig Tagline (Hook)
Turn messy spreadsheets into powerful, automated Excel dashboards that give you instant clarity, smarter decisions, and total control over your data.
If your data feels overwhelming, I’ll transform it into clean, visual, and intelligent reports that actually drive results.
3️⃣ Long-Form Gig Description
🔹 Introduction – Stop Guessing. Start Seeing the Bigger Picture.
Are you drowning in spreadsheets?
Struggling with manual reports, confusing formulas, broken VLOOKUPs, or outdated Excel files that take hours to update?
You’re not alone.
Most businesses collect data. Very few actually use it effectively.
That’s where I come in.
I design advanced Excel dashboards with powerful formulas, VLOOKUP/XLOOKUP, Pivot Tables, automation, and dynamic charts that turn raw data into clear insights — instantly.
Whether you're tracking sales, expenses, KPIs, inventory, performance metrics, or financial data, I build dashboards that are:
-
Automated
-
Accurate
-
Visually compelling
-
Easy to use
-
Built for real business decisions
This isn’t basic spreadsheet work. This is strategic Excel engineering.
🔹 Service Overview – What You’ll Get
I provide custom-built Excel dashboards and reports tailored specifically to your business needs.
My services include:
✔ Advanced Excel formulas (IF, INDEX-MATCH, XLOOKUP, SUMIFS, COUNTIFS, OFFSET, etc.)
✔ VLOOKUP / XLOOKUP integration for dynamic data linking
✔ Pivot Tables & Pivot Charts
✔ Interactive Excel dashboards
✔ Dynamic charts & data visualization
✔ Data cleaning and structuring
✔ Automated reporting systems
✔ KPI tracking dashboards
✔ Financial modeling support
✔ Excel performance optimization
Every dashboard is:
-
Clean and professional
-
Fully automated where possible
-
Easy to update
-
Built for scalability
-
Designed with business logic, not just formatting
Unlike generic Excel gigs, I don’t just “add charts.”
I design systems that reduce errors, save hours of work, and support smarter decisions.
🔹 Deep Benefits Breakdown – What This Means for You
📊 1. Instant Clarity
No more scanning rows of raw numbers.
You’ll see your performance in seconds through dynamic graphs, trend lines, and KPI indicators.
⏳ 2. Save Hours Every Week
Manual reports waste time. My dashboards automate calculations so you can:
-
Update data with one click
-
Eliminate repetitive work
-
Reduce spreadsheet errors
Time saved = productivity gained.
💰 3. Make Better Financial Decisions
With properly structured formulas and lookup systems, you’ll avoid:
-
Incorrect totals
-
Broken references
-
Duplicate calculations
-
Misaligned data
Better data → Better decisions → Better profits.
📈 4. Impress Stakeholders & Clients
A polished Excel dashboard builds authority.
Whether you’re presenting to investors, managers, or clients, your reports will look professional and strategic — not amateur.
🔍 5. Eliminate Spreadsheet Chaos
If your Excel file is:
-
Slow
-
Messy
-
Confusing
-
Overloaded with inconsistent formulas
I’ll restructure it into a clean, high-performance system.
🧠 6. Peace of Mind
You’ll know your numbers are accurate, structured, and reliable.
No more second-guessing your reports.
🔹 My Process & Workflow – Professional & Structured
I follow a clear and organized workflow to ensure premium results.
Step 1: Requirement Discovery
We clarify:
-
Your business goals
-
Type of data
-
Reporting frequency
-
Key metrics to track
-
Current spreadsheet issues
This ensures the dashboard solves the right problem.
Step 2: Data Analysis & Structure Design
I analyze your data structure and:
-
Clean inconsistencies
-
Standardize formats
-
Design an optimized backend sheet
-
Map relationships using VLOOKUP/XLOOKUP or INDEX-MATCH
Strong backend = reliable dashboard.
Step 3: Formula Engineering
This is where expertise matters.
I build:
-
Error-proof formulas
-
Nested logic functions
-
Conditional formatting systems
-
Automated calculations
Everything is optimized for performance.
Step 4: Dashboard Design & Visualization
Your dashboard will include:
-
Dynamic charts
-
Slicers & filters
-
KPI summary cards
-
Performance comparisons
-
Clean layout with professional formatting
Clarity and usability are my top priorities.
Step 5: Testing & Optimization
Before delivery, I:
-
Test all formulas
-
Validate calculations
-
Ensure smooth filtering
-
Optimize file speed
You receive a fully functional, tested Excel file.
Step 6: Delivery & Support
You’ll get:
-
Final Excel dashboard file
-
Instructions (if needed)
-
Revision support
Clear communication throughout.
🔹 Why Choose Me Instead of a Cheap Excel Gig?
Excel is easy to learn.
But advanced Excel systems require deep logic, data thinking, and business understanding.
Here’s what separates this gig:
✔ Business-Focused Approach
I don’t just build spreadsheets. I build reporting systems aligned with business goals.
✔ Advanced Formula Expertise
Complex lookups, nested conditions, dynamic ranges — handled professionally.
✔ Clean Architecture
No messy formulas scattered everywhere. Everything is structured logically.
✔ Reliable Communication
You’ll always know what stage your project is in.
✔ Long-Term Scalability
Your dashboard will grow with your data.
Cheap spreadsheets break.
Professional dashboards perform.
🔹 Who This Gig Is Perfect For
This service is ideal for:
-
Small and medium businesses
-
Startup founders
-
E-commerce sellers
-
Financial analysts
-
Marketing managers
-
Operations managers
-
Accountants
-
Agencies handling reporting
-
Anyone managing large Excel datasets
If you rely on Excel for decision-making, this gig is for you.
🔹 Who This Gig Is NOT For
To maintain high standards, this gig is NOT for:
-
People looking for unrealistic 1-hour complex builds
-
Clients unwilling to clarify requirements
-
Those who want extremely advanced software-level automation beyond Excel’s scope
-
Buyers seeking $5 quick fixes for complex projects
I focus on quality and long-term value.
🔹 Use Cases & Real-World Scenarios
Here’s how clients typically use my Excel dashboards:
📌 Sales Dashboard
Track monthly revenue, conversion rates, product performance, and team KPIs.
📌 Financial Reporting
Automated income statements, expense tracking, and cash flow visualization.
📌 Inventory Management
Monitor stock levels, reorder alerts, and supplier tracking.
📌 Marketing Analytics
Track campaign performance, ROAS, leads, and engagement metrics.
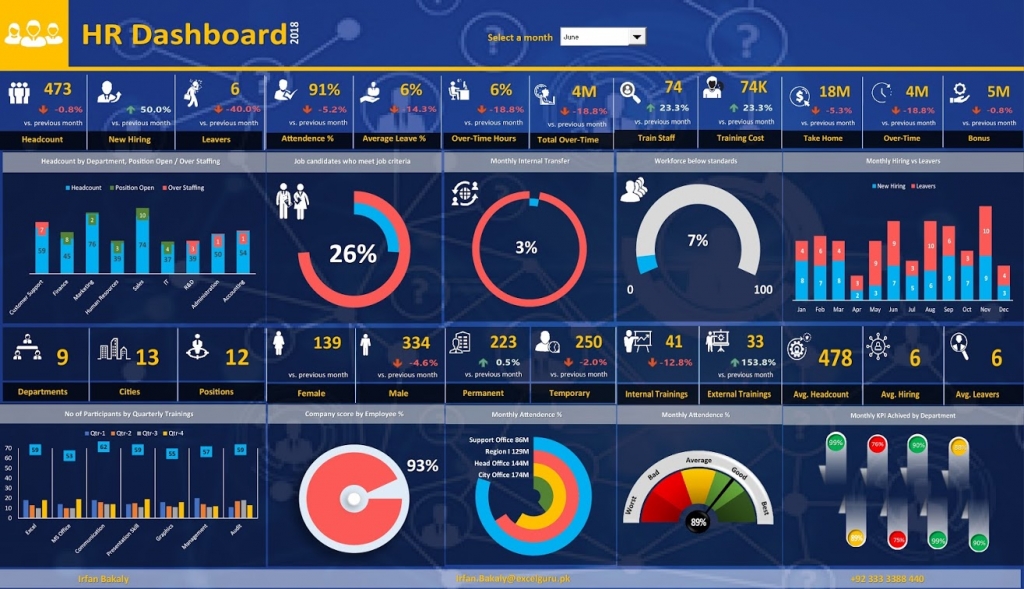
📌 HR & Performance Tracking
Employee performance metrics, attendance dashboards, bonus calculations.
📌 Project Management
Timeline tracking, budget vs. actual reports, and milestone monitoring.
In every case, the goal is the same:
Clear data. Faster insights. Smarter decisions.
🔹 Strong Call to Action
If you're tired of struggling with complicated spreadsheets and unreliable formulas…
If you want a professional Excel dashboard that works flawlessly…
Message me today with a brief overview of your project.
Let’s turn your data into a powerful decision-making system.
Premium quality. Professional structure. Real business results.
Frequently Asked Questions
1. Can you fix my existing Excel file instead of creating a new one?
Yes. I can audit, clean, optimize, and upgrade your current Excel sheet.
2. Do you work with large datasets?
Absolutely. I design optimized dashboards for large data volumes while maintaining performance.
3. Can you automate repetitive Excel tasks?
Yes. Using formulas, structured tables, and logic systems, I reduce manual work significantly.
0 Reviews
0.0
0 rating
5 Star
0%
4 Star
0%
3 Star
0%
2 Star
0%
1 Star
0%